Simple Shell Scripting for Scientists, Day One: Exercise
This is an exercise for you to try once you have attended the first day of the Simple Shell Scripting for Scientists course. Solutions to this exercise will be examined on the next day of this course, so you must attempt this exercise before then or you may find it very difficult to follow the remaining days of this course.
The course notes for this day of the course are available (as a PDF) here.
This exercise was designed to be run on PWF Linux.
It is recommended that you try it on a PWF Linux
system, as that is the environment in which it has been tested. However,
it should work on most modern Linux distributions that have gnuplot 4.0
or higher (with PNG support),
and Eye of GNOME 2.9.0
or higher (or another appropriate PNG
viewer), installed.
If you don't do this exercise under PWF Linux
you may need to recompile the iterator program (see the
README file in the archive
of files from the first day of the course for details). You should also have
a look at the compatibility notes.
In order to do this exercise, you'll need to get hold of the files used in class. If you are doing this on PWF Linux, then after you have logged in, type the following:
cd "${UX}"/Lessons/Shell-Scripting-Scientists

./setup-day-one.sh
You'll be asked for a directory into which the files should be placed, the
files will be unpacked to that directory and then set up for you. Look at
the README file in the directory to which the files have been
unpacked for instructions on how to run the script constructed in class.
If you are not doing this exercise on PWF Linux,
then you'll need to get copies of the files that were used in class onto your
own system and set up properly. These files are available in an archive here.
You'll also need to unpack the archive and set things up with this setup-day-one.sh
script. Download the archive and
setup-day-one.sh script to the
same directory. cd to the directory into which you downloaded
those two files. Make sure the setup-day-one.sh script is
executable by typing:
chmod +x setup-day-one.sh
and then run it by typing:
./setup-day-one.sh
The setup-day-one.sh script will ask you for a directory into
which it should unpack the archive and will then set everything up for you.
Once the archive is successfully unpacked, see the README file
for details of what it contains. This file also gives brief instructions on
how to recompile the iterator source code, in case the
precompiled version of iterator included in the archive won't run
on your system.
On the first day of this course we've created some shell scripts that run
the iterator program for several parameter sets. These scripts
make sure that the results of running iterator with a particular
parameter set have names that correspond to the last parameter in the
parameter set.
Change to the directory containing the iterator program and
the answers and scripts subdirectories. First of
all, make sure that the run-once.sh shell script in the scripts
subdirectory has been modified as we did during the course. You can do this
by overwriting the copy in the scripts subdirectory with the
copy provided in the answers subdirectory like this:
cp -pf answers/run-once.sh scripts/run-once.sh
(You only need to to do this once.)
Now type the following:
rm -f *.dat stdout-* logfile

scripts/multi-run.sh 0.05 0.1 0.15 0.2 0.25 0.3 0.35 0.4 0.45 0.5
This will run the iterator program 10 times, and each output.dat
file will be renamed to something like output-0.05.dat, output-0.1.dat,
etc. Now that's all very well, but it would be nice to actually see those
results in graphical form.
In the gnuplot subdirectory you will find a file called
iterator.gplt. This file contains some commands for the
gnuplot program telling
it how to turn the output.dat file produced by iterator
into a graph. This file has been set up so that it requires a file called
output.dat file to be in the current directory when gnuplot
is started. It will create a graph from output.dat and store its
results in the current directory as a PNG
file called output.png.
First of all, let's copy the iterator.gplt file to the current
directory:
cp -p gnuplot/iterator.gplt .
Now let us try creating a graph with gnuplot
and this file. Type:
cp output-0.05.dat output.dat

gnuplot iterator.gplt

ls

rm -f output.dat

eog output.png &
The output of ls should show that a file called output.png
has been created. The eog
program will actually display the file for you so that you can see what it
looks like. Neat, huh?
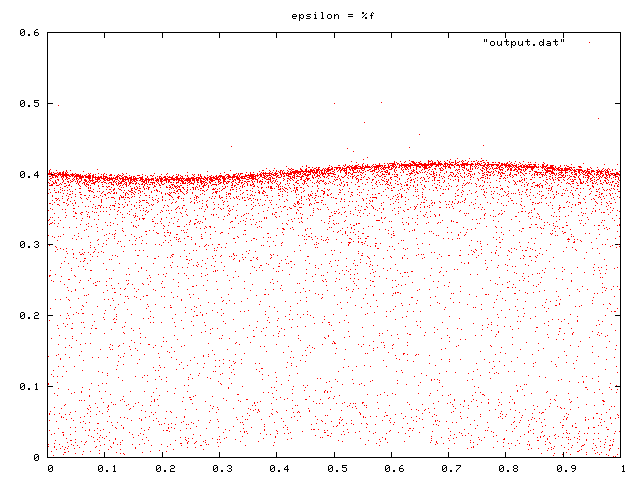
(For example, the output.png file for the output.dat
file that is produced by running the iterator program with the
parameters 100 100 1000 0.05 looks like this.)
Your task is to write a shell script that will work its way through all
the renamed output.dat files and use gnuplot
(with the iterator.gplt file) to create an output.png
file for each of them. Each output.png will need to be renamed
or else it will be overwritten. You should rename each file to a name similar
to that of the output.dat file from which it was generated (e.g.
if output.png is the graph of the output-0.05.dat
file, you could rename it to output-0.05.dat.png).
If you understand what to do, then give it a try. If you aren't sure what you should be doing, perhaps the following description of the above task will make it clearer:
We have a directory containing a number of output files, which are all
called output-<something>.dat (where <something>
is a number). What we want to do is, for each of
those files, do the following:
Rename (or copy) the output file we want to process to output.dat.
mv output-0.05.dat output.dat
Run gnuplot with
the iterator.gplt file.
gnuplot iterator.gplt
Rename (or delete if you copied the original .dat file)
output.dat.
mv output.dat output-0.05.dat
Rename output.png.
mv output.png output-0.05.dat.png
We'll be looking at your answers to this exercise on the next day of this course, so you need to have attempted it before then.
Hint: you'll probably want to use a for loop over all
the .dat files in the directory.
There are two obvious ways of approaching this task: one would be to modify
the run-once.sh script we created in this course to create an
output.png file each time it processes a parameter set. The
other way would be to write a completely separate script that is designed to
run after the multi-run.sh script has completed, i.e. first
run multi-run.sh, then run this new script to create output.png
files for all the renamed output.dat files previously created by
run-once.sh. For this exercise I'd like you to try the second
approach, i.e. write a completely separate script. Of course, feel free
to cannibalise the multi-run.sh and run-once.sh
scripts if you find that useful.
Here are some examples of what the output.png files
produced by your shell script for various parameter sets should look like:
Parameter set: 100 100 1000 0.05
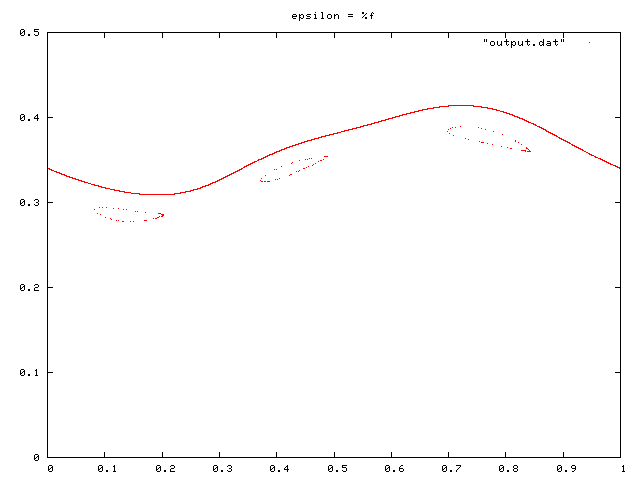
Parameter set: 100 100 1000 0.25
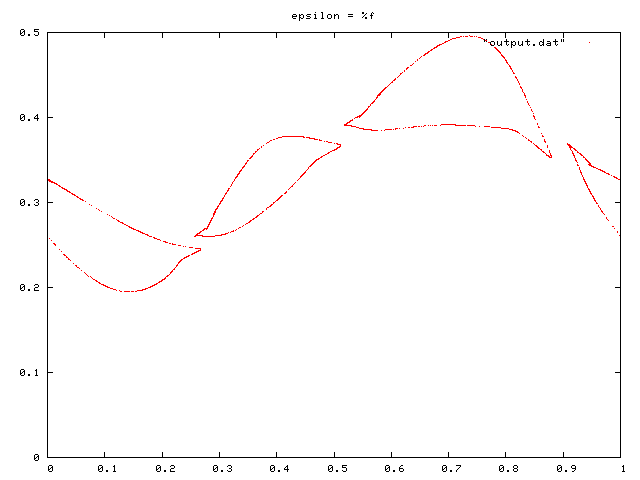
Parameter set: 100 100 1000 0.5
If you are not doing this exercise under PWF Linux then you should be aware of the following issues which may arise when using other Linux/Unix systems:
The compiled version of the iterator program provided in
this archive was compiled
on an Intel Core 2 Duo Processor E6300 under openSUSE 11.2
(2.6 kernel, GLIBC 2.10.1), using GCC 4.4. It is not guaranteed to work
on any other Linux/Unix distribution and/or architecture. If it will not
run then you'll have to compile it from source. See the README
file in the archive for details.
You may have problems if you are using a shell other than bash. You may also have problems if you are using a version of bash earlier than version 2.04. Note that the scripts used in this course were all written to run under bash 4.0, but it is believed that they will run under bash 2.04 or higher (no promises, though).
The gnuplot commands
used have only been tested with gnuplot 4.0 and 4.2.
They will probably work with gnuplot 3.7 or higher, but this has not been tested.
The version of gnuplot
you use must have PNG
support. This usually depends on how your version of gnuplot
has been compiled. To find out if it has PNG
support, start gnuplot and
type the following:
show version long
If under Compile options either +PNG or +GD_PNG
is listed, then your version of gnuplot
has been compiled with PNG
support.
If you do not have Eye of GNOME (eog)
on your system, almost any other PNG
viewer will do. Most modern web browsers can view PNG
files. A list of some applications that support the PNG
format is given here.